Fitting
Mikis Stasinopoulos
Bob Rigby
Fernanda De Bastiani
Introduction
the basic GAMLSS algorithmdifferent statistical approaches for fitting a GAMLSS modeldifferent machine learning techniques for fitting a GAMLSS model.
Machine Learning Models
properties
are the standard errors available?
do the x’s need standardization.
about the algorithm
 - stability
 - speed
 - convergence
nonlinear terms
interactions
dataset type
is the selection of x’s automatic?
interpretation
Linear Models
Linear Models
******************************************************************
Family:  c("BCTo", "Box-Cox-t-orig.")

Call:  gamlss(formula = rent ~ area + poly(yearc, 2) + location +
    bath + kitchen + cheating, sigma.formula = ~area +
    yearc + location + bath + kitchen + cheating, family = BCTo,
    data = da, trace = FALSE)

Fitting method: RS()

------------------------------------------------------------------
Mu link function:  log
Mu Coefficients:
                 Estimate Std. Error t value Pr(>|t|)
(Intercept)     5.0138582  0.0277852 180.451  < 2e-16 ***
area            0.0106311  0.0002331  45.613  < 2e-16 ***
poly(yearc, 2)1 5.0382576  0.3360044  14.995  < 2e-16 ***
poly(yearc, 2)2 3.3475762  0.2737237  12.230  < 2e-16 ***
location2       0.0875504  0.0102485   8.543  < 2e-16 ***
location3       0.1967006  0.0385032   5.109 3.44e-07 ***
bath1           0.0415393  0.0219353   1.894   0.0584 .
kitchen1        0.1120385  0.0243199   4.607 4.25e-06 ***
cheating1       0.3297044  0.0243422  13.545  < 2e-16 ***
---
Signif. codes:  0 '***' 0.001 '**' 0.01 '*' 0.05 '.' 0.1 ' ' 1

------------------------------------------------------------------
Sigma link function:  log
Sigma Coefficients:
              Estimate Std. Error t value Pr(>|t|)
(Intercept) 10.4022601  0.7528378  13.817  < 2e-16 ***
area         0.0012116  0.0006135   1.975   0.0484 *
yearc       -0.0059332  0.0003864 -15.356  < 2e-16 ***
location2    0.0595118  0.0254048   2.343   0.0192 *
location3    0.2191754  0.0930995   2.354   0.0186 *
bath1        0.0058254  0.0087229   0.668   0.5043
kitchen1     0.0400246  0.0882200   0.454   0.6501
cheating1   -0.2453139  0.0487224  -5.035 5.06e-07 ***
---
Signif. codes:  0 '***' 0.001 '**' 0.01 '*' 0.05 '.' 0.1 ' ' 1

------------------------------------------------------------------
Nu link function:  identity
Nu Coefficients:
            Estimate Std. Error t value Pr(>|t|)
(Intercept)  0.65631    0.05598   11.72   <2e-16 ***
---
Signif. codes:  0 '***' 0.001 '**' 0.01 '*' 0.05 '.' 0.1 ' ' 1

------------------------------------------------------------------
Tau link function:  log
Tau Coefficients:
            Estimate Std. Error t value Pr(>|t|)
(Intercept)   3.2918     0.4411   7.463 1.09e-13 ***
---
Signif. codes:  0 '***' 0.001 '**' 0.01 '*' 0.05 '.' 0.1 ' ' 1

------------------------------------------------------------------
No. of observations in the fit:  3082
Degrees of Freedom for the fit:  19
      Residual Deg. of Freedom:  3063
                      at cycle:  10

Global Deviance:     38254.51
            AIC:     38292.51
            SBC:     38407.14
******************************************************************
Additive Models
Additive Models
          df      AIC
mAM 29.78058 38198.79
mLM 19.00000 38292.51
Additive Models (continue)
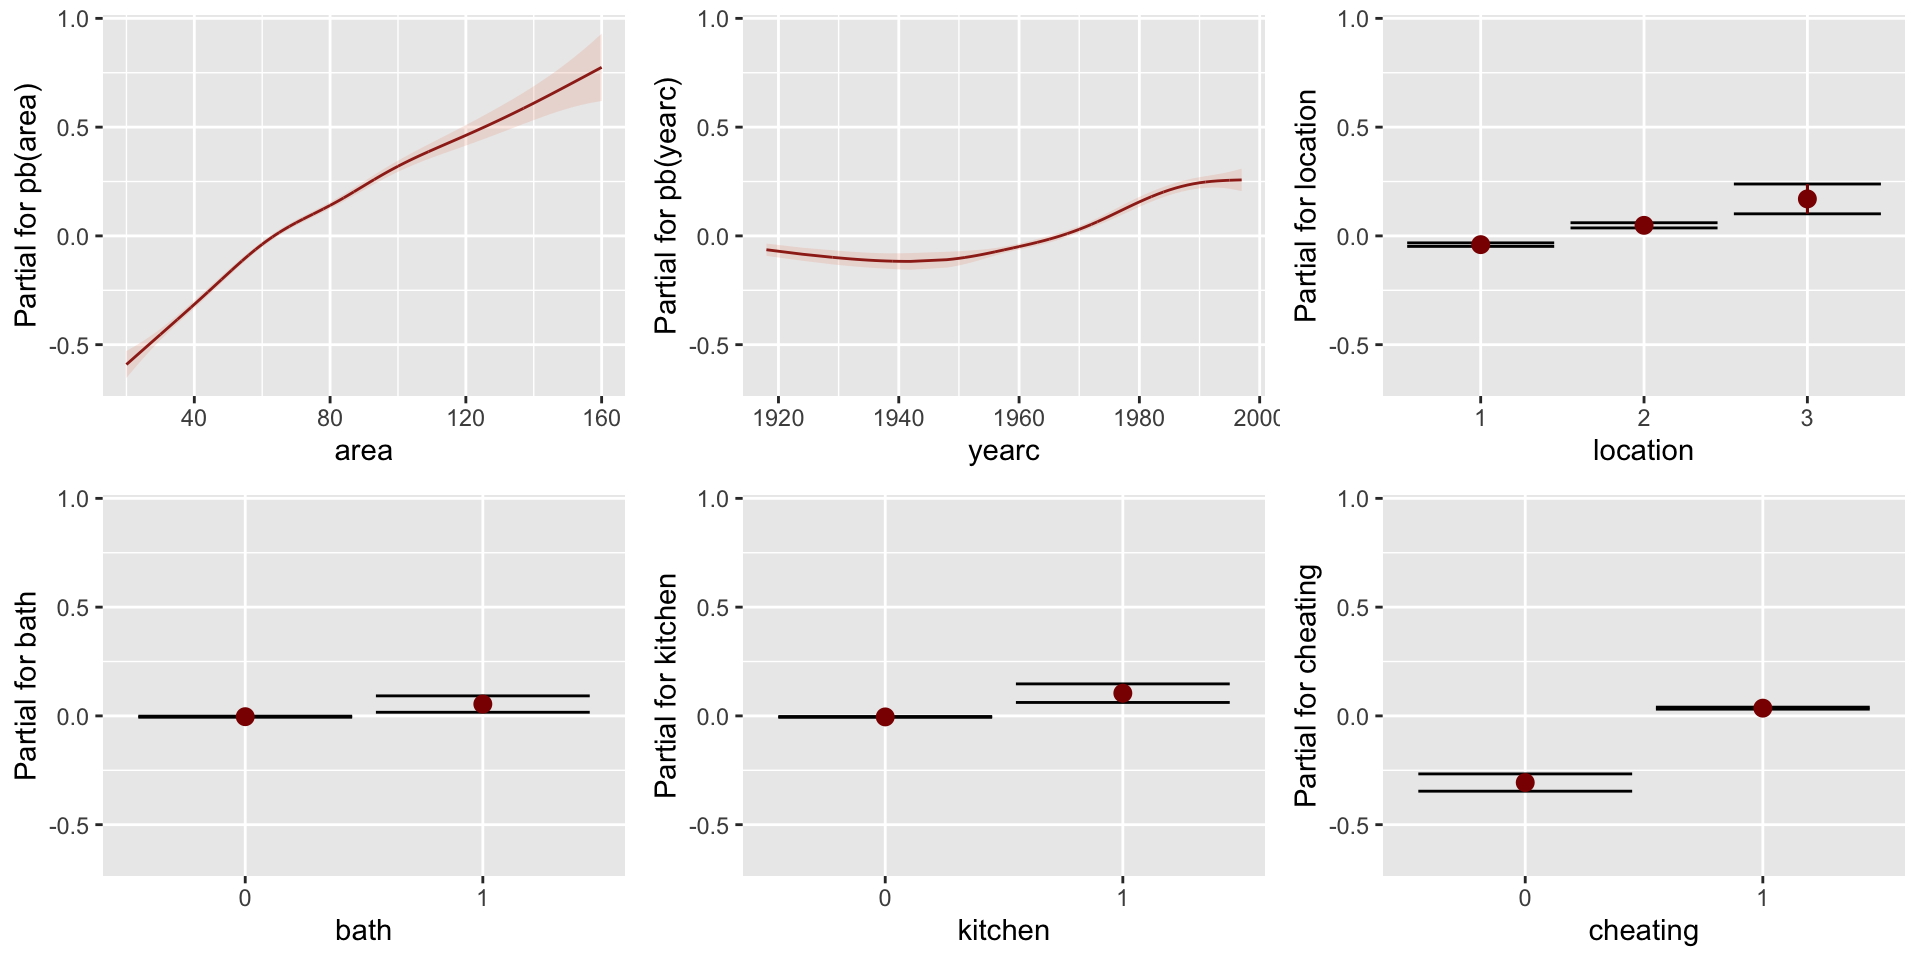
Figure 1: pdf-plot of the fitted am1 mu model
Additive Models (continue)
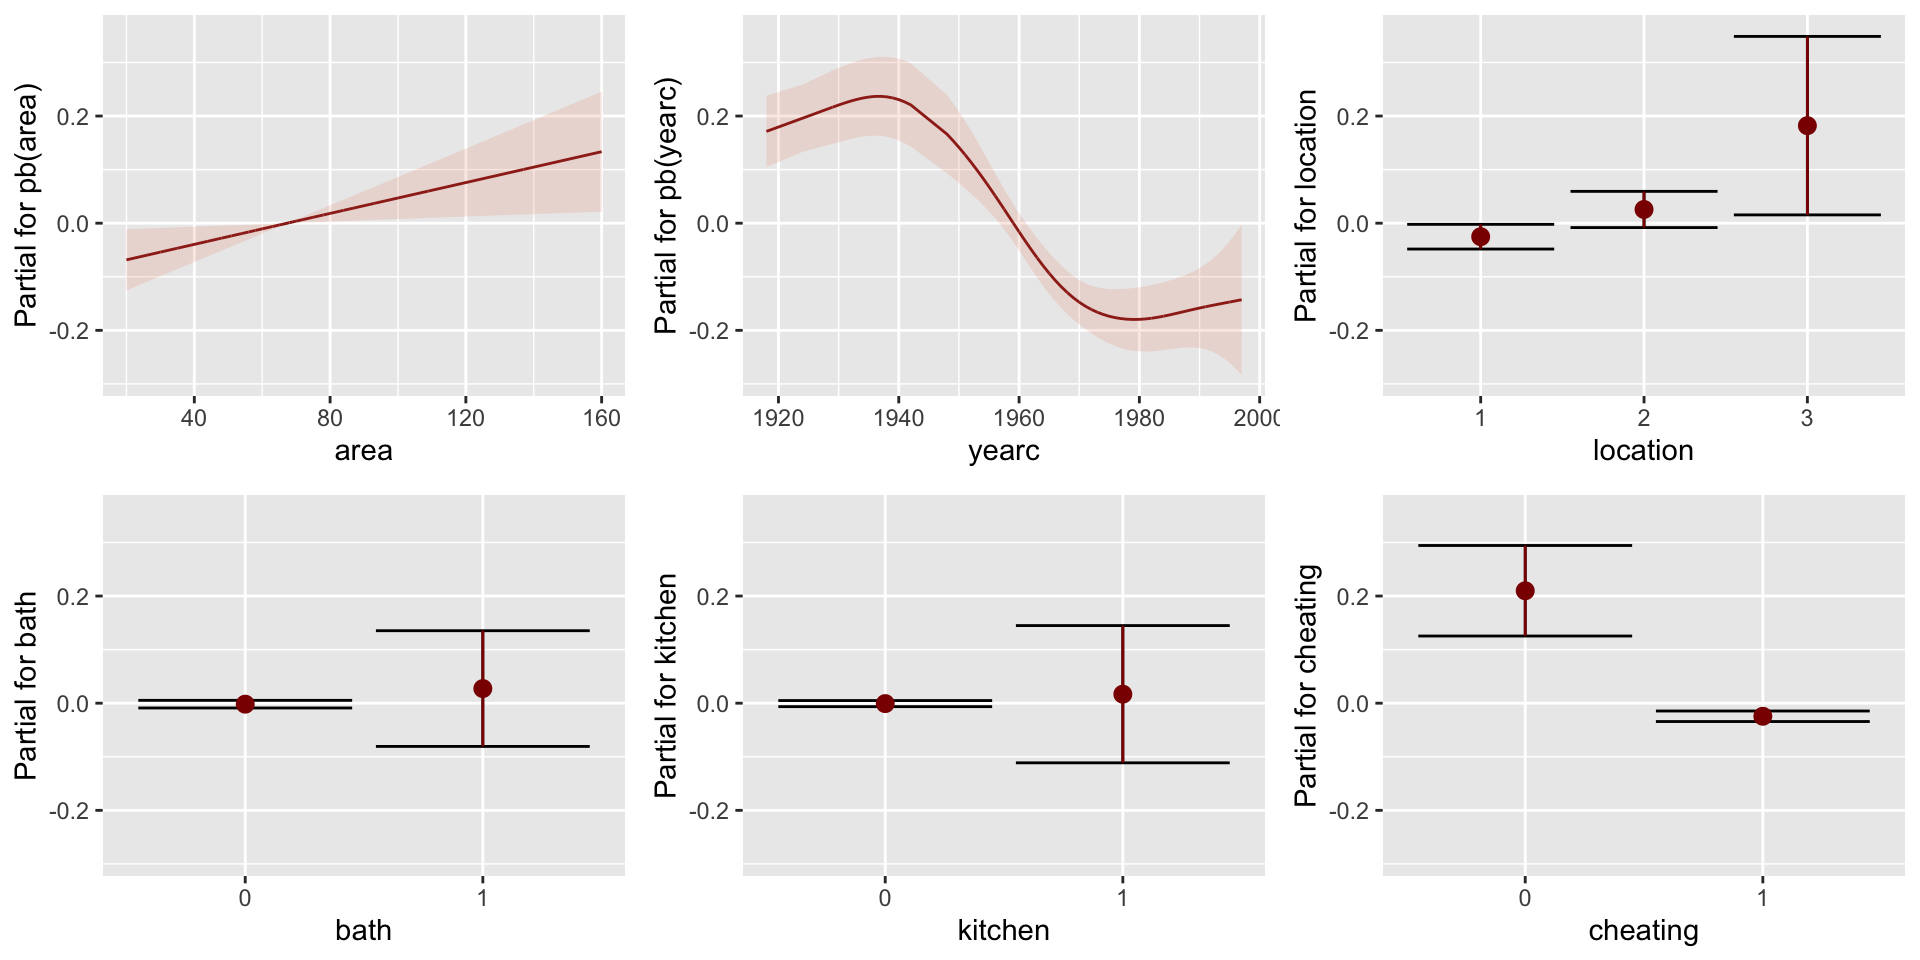
Figure 2: pdf-plot of the fitted am1 sigma model
Regression Trees
Regression Trees
          df      AIC
mAM 29.78058 38198.79
mLM 19.00000 38292.51
mRT 22.00000 38711.66
Regression Trees (continue)
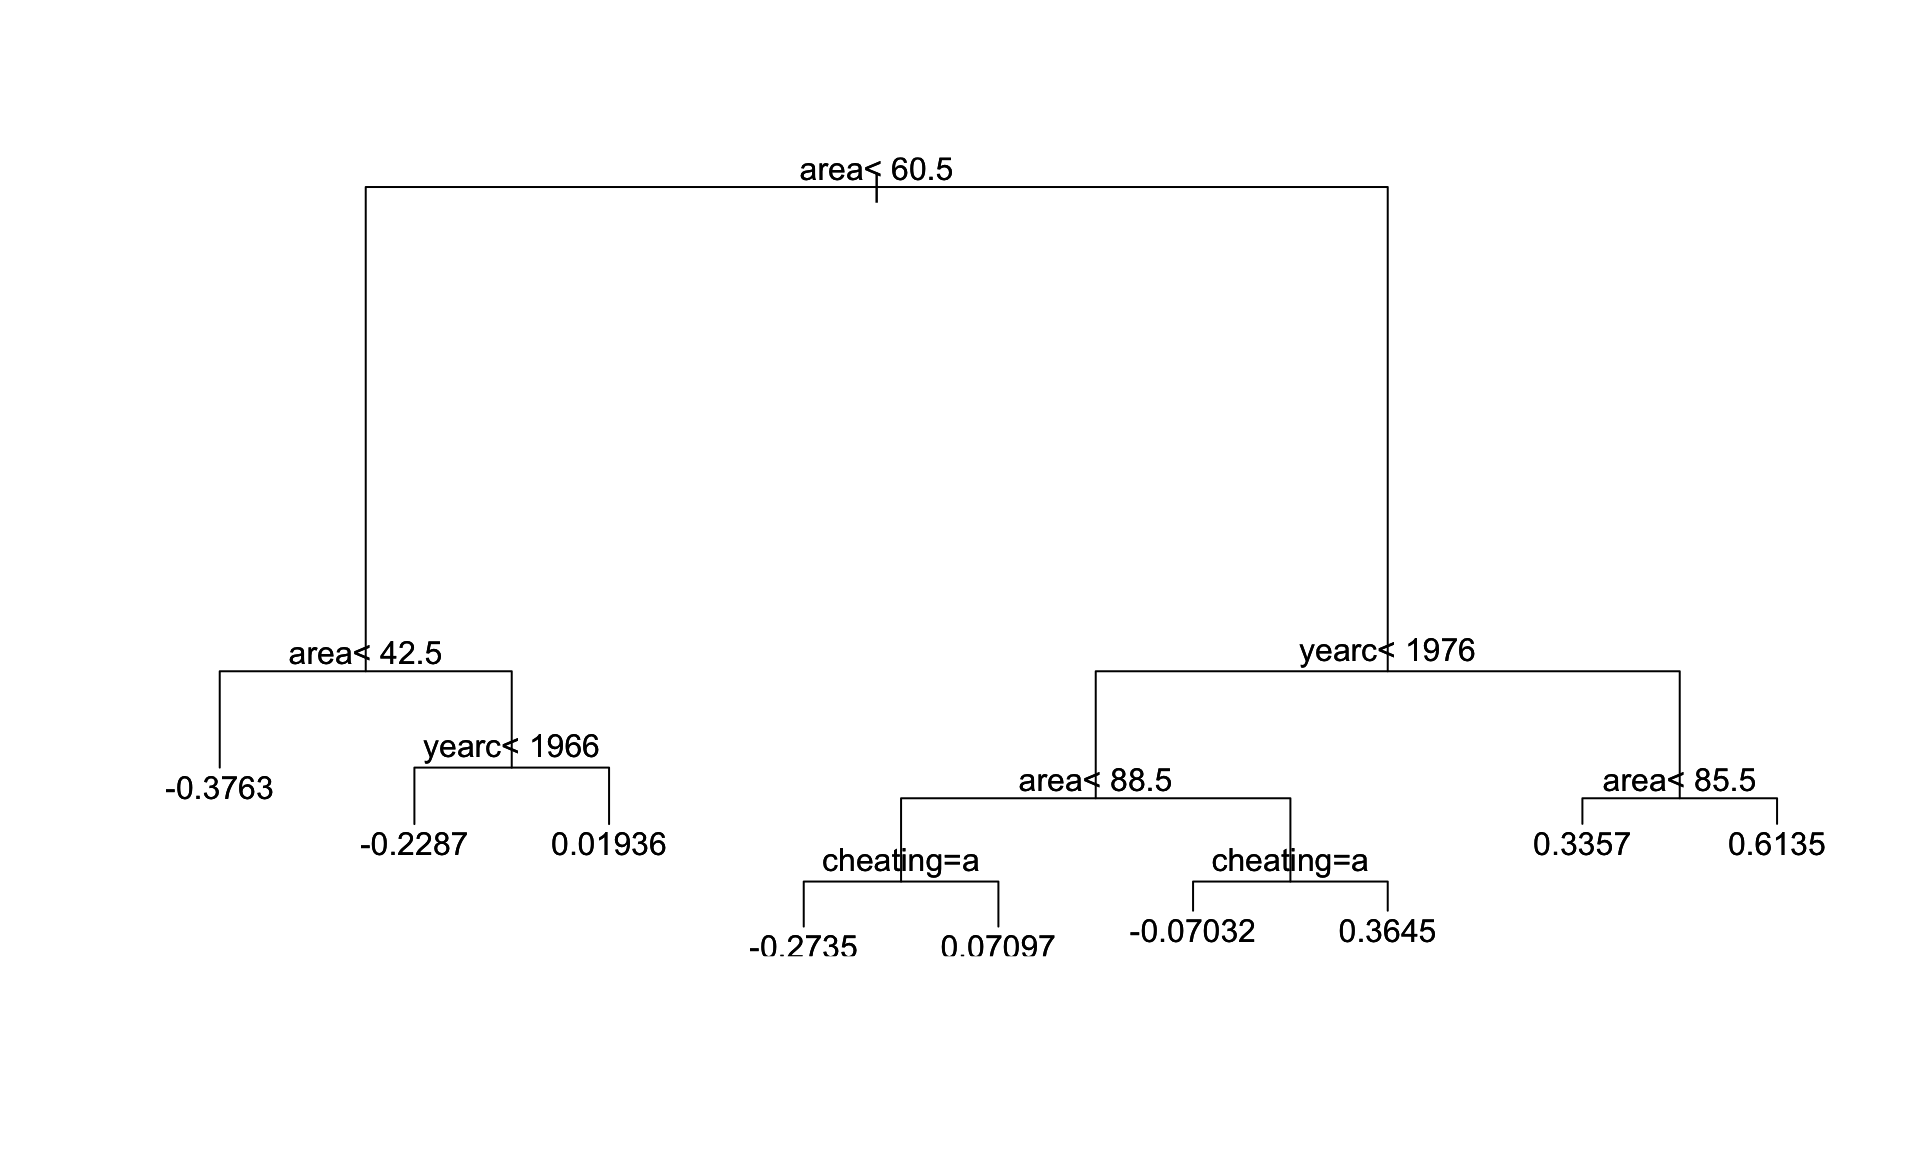
Figure 3: The fitted tree for mu model
Regression Trees (continue)
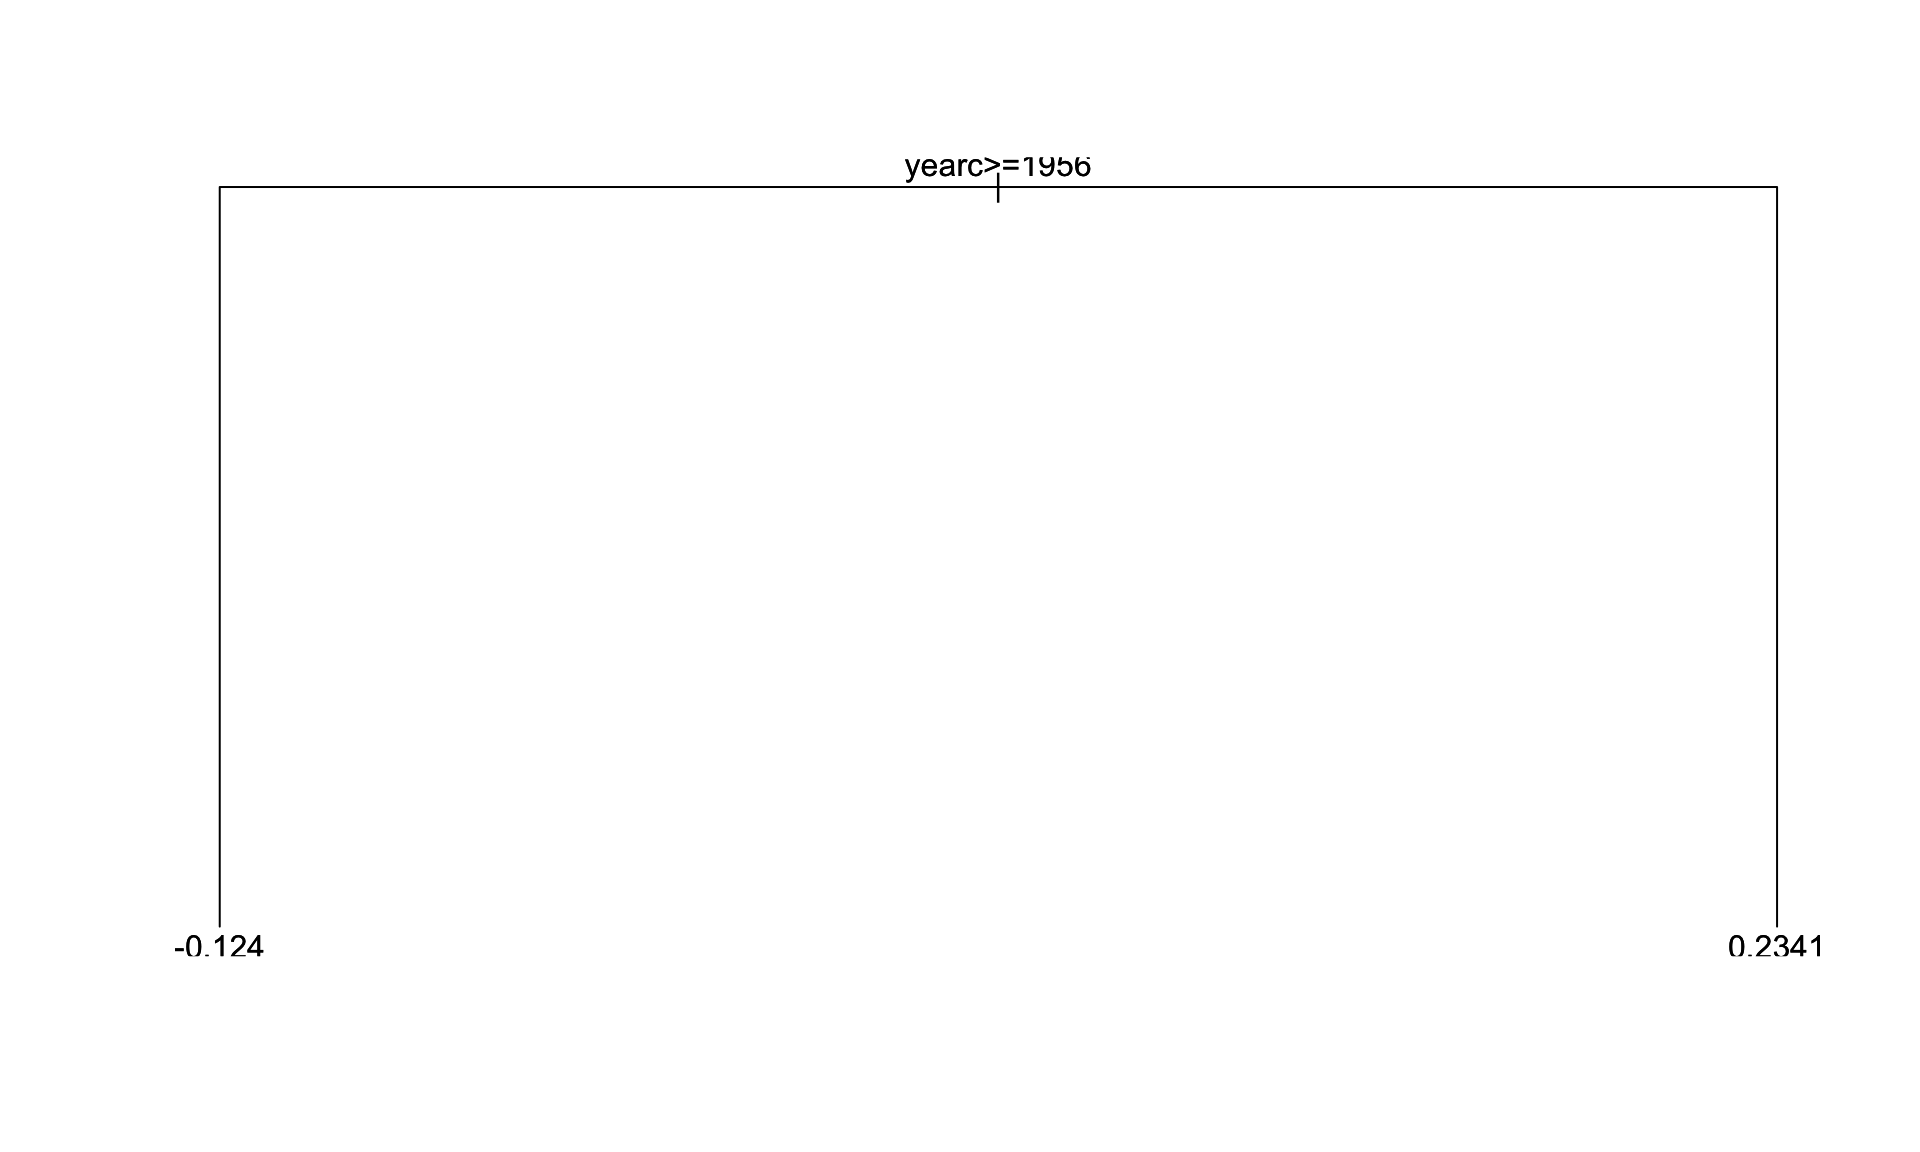
Figure 4: The fitted tree for mu model
Neural Networks
Neural Networks
GAMLSS-RS iteration 1: Global Deviance = 38089.89
GAMLSS-RS iteration 2: Global Deviance = 38054.95
GAMLSS-RS iteration 3: Global Deviance = 38054.1
GAMLSS-RS iteration 4: Global Deviance = 38053.9
GAMLSS-RS iteration 5: Global Deviance = 38053.84
GAMLSS-RS iteration 6: Global Deviance = 38053.79
GAMLSS-RS iteration 7: Global Deviance = 38053.78
GAMLSS-RS iteration 8: Global Deviance = 38053.78
GAMLSS-RS iteration 9: Global Deviance = 38053.78 df AIC
mAM 29.78058 38198.79
mNN 78.00000 38209.78
mLM 19.00000 38292.51
mRT 22.00000 38711.66Neural Networks (continue)
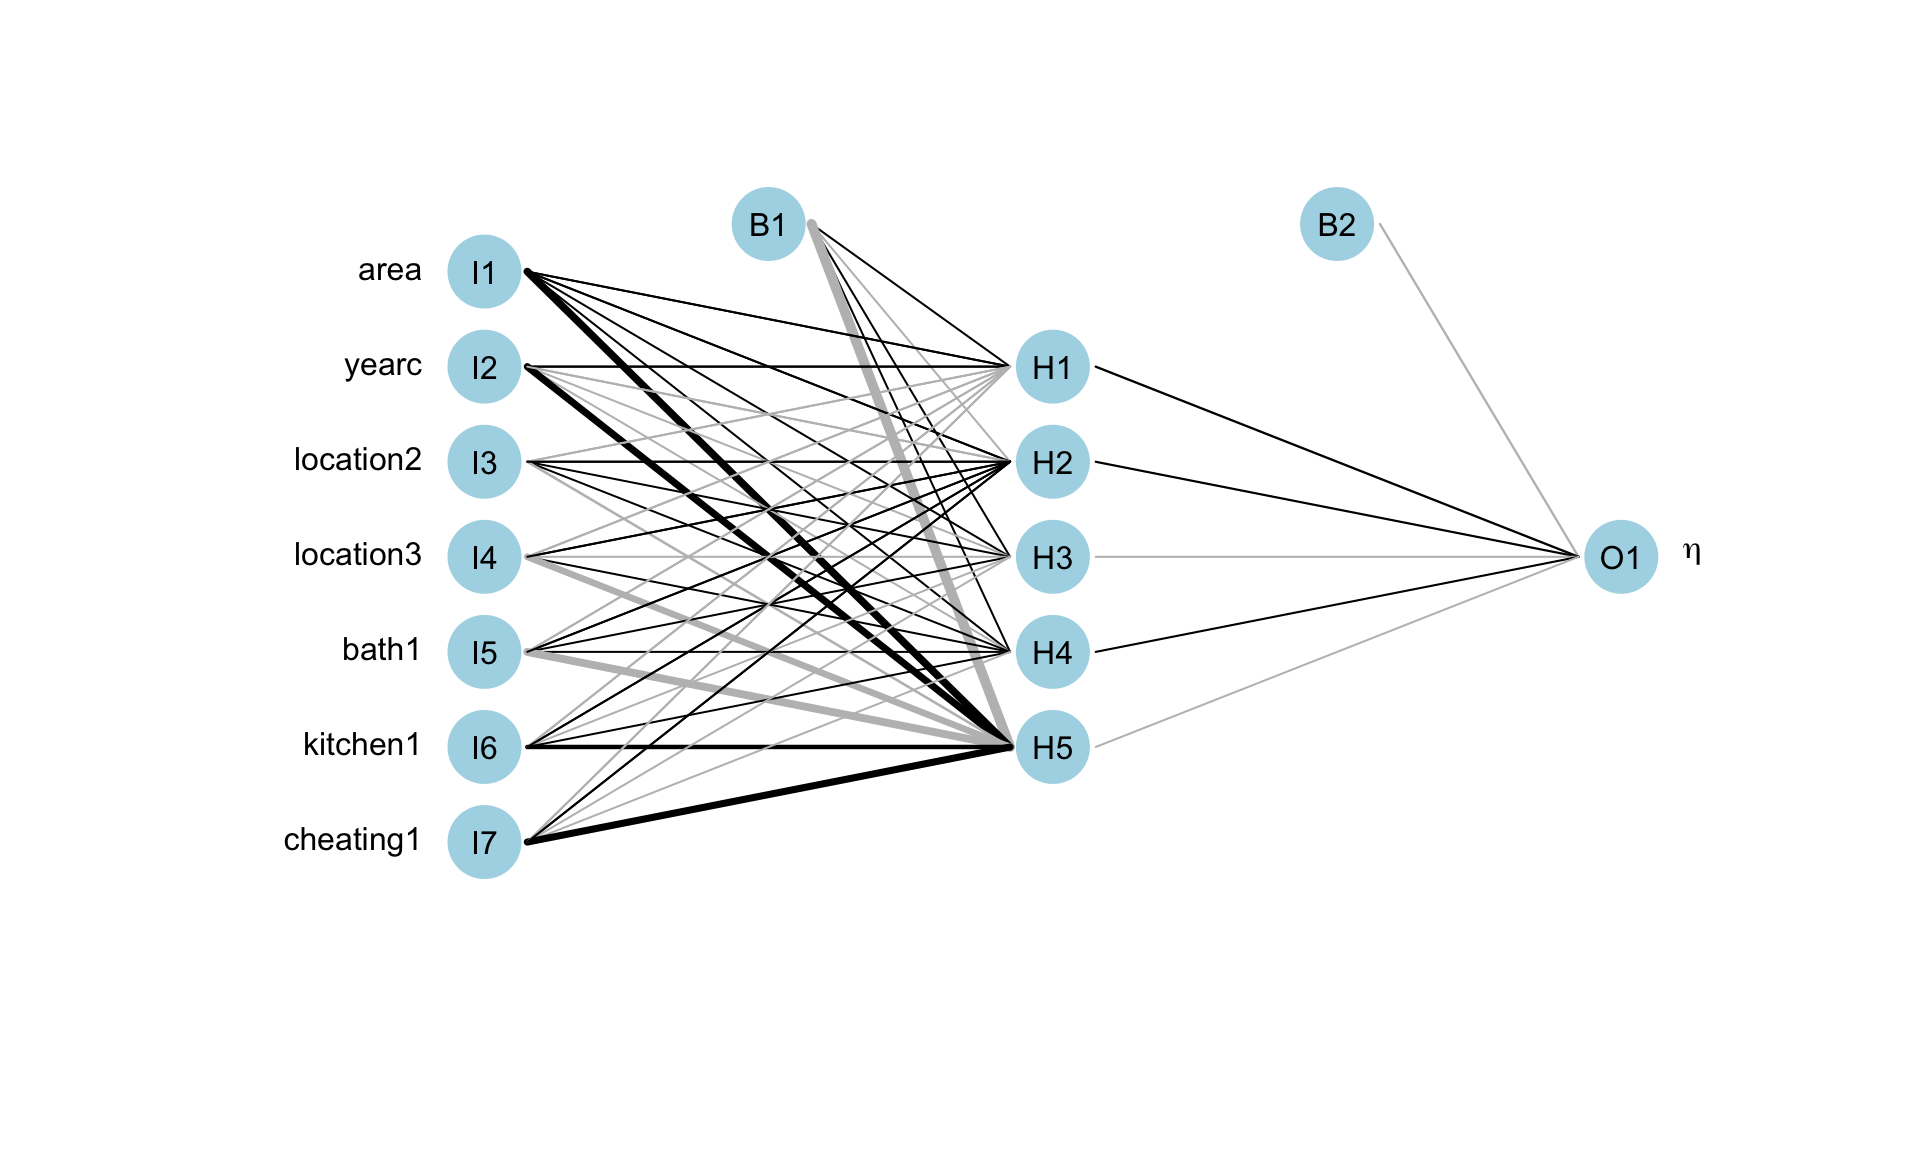
Figure 5: The fitted neural network model fot mu.
Neural Networks
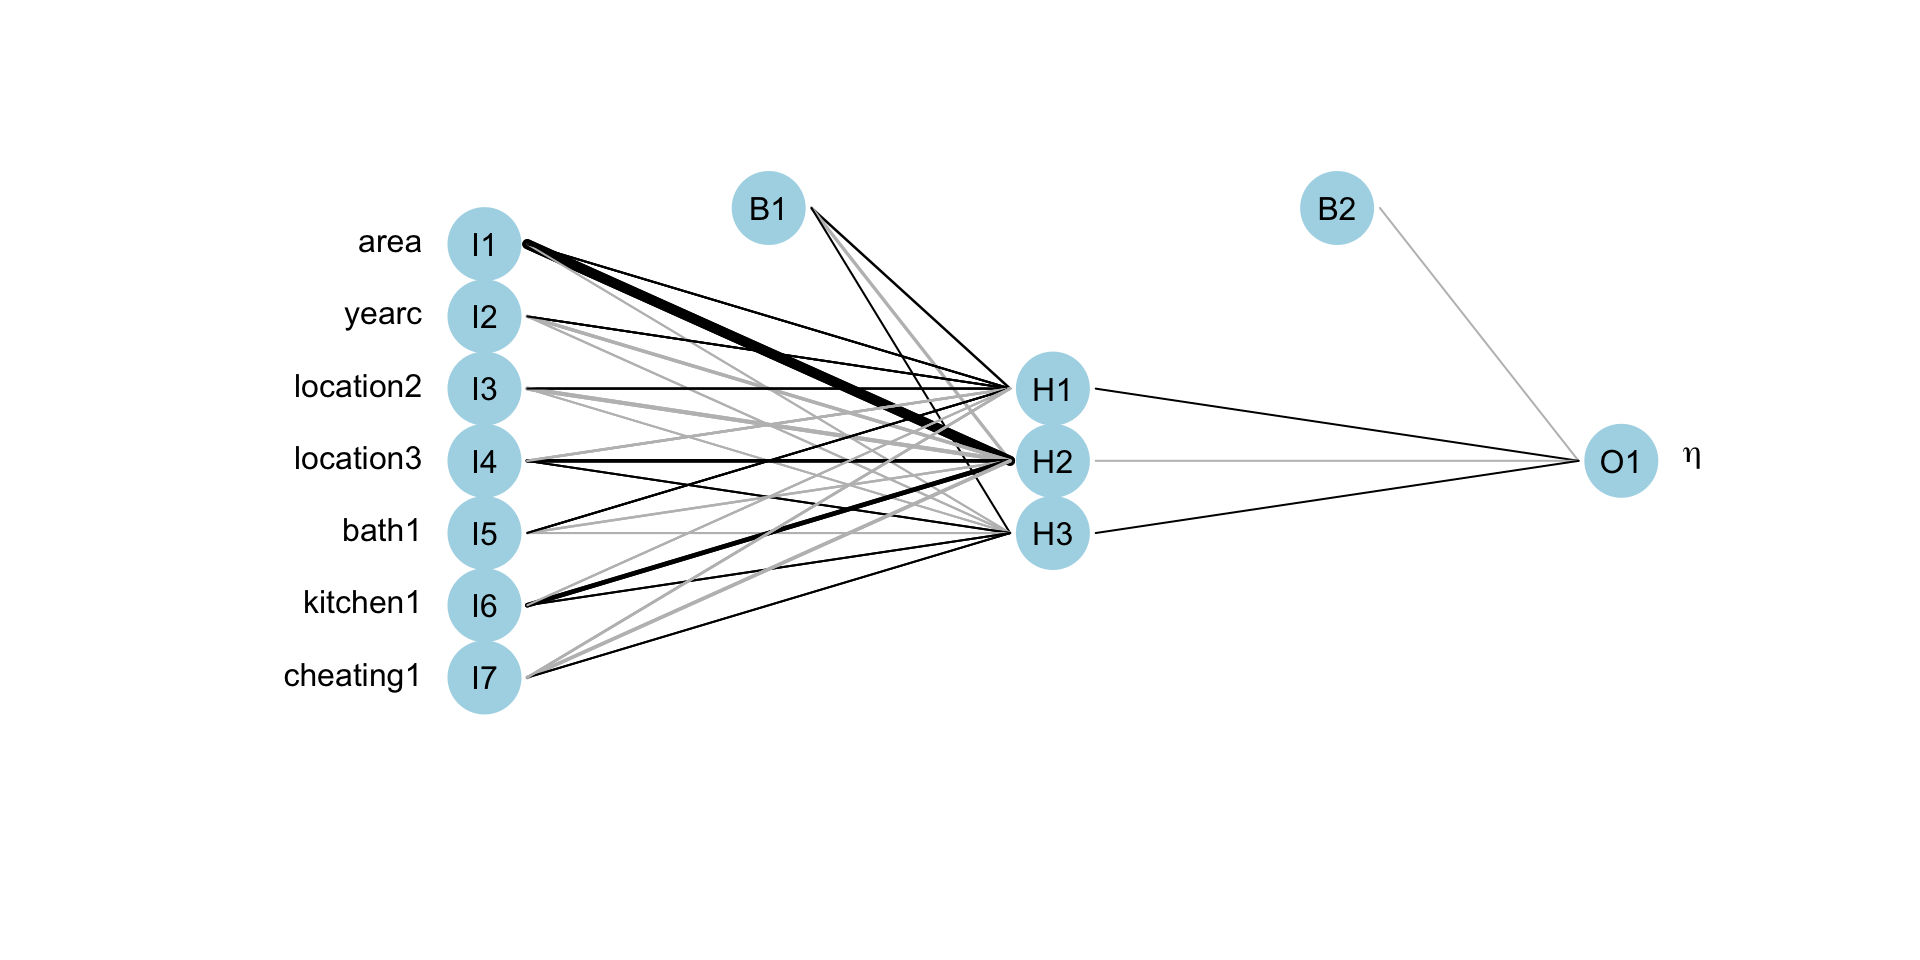
Figure 6: The fitted neural network model fot sigma.
LASSO
library(gamlss.lasso)
source("~/Dropbox/github/gamlss-ggplots/R/data_stand.R")
da10 <- data_scale(da, response=rent)
da1 <- data_form2df(da10,  response=rent, type="main.effect",
                   nonlinear="TRUE", arg=3)
mLASSO <- gamlss(rent~gnet(x.vars=names(da1)[-c(1)],
                    method = "IC", ICpen="BIC"),
                     ~gnet(x.vars=names(da1)[-c(1)],
                     method = "IC", ICpen="BIC"),
                 data=da1, family=BCTo, bf.cyc=1,
                c.crit=0.1, trace=FALSE)
AIC(mLM, mAM, mRT, mNN,  mLASSO)
LASSO
             df      AIC
mAM    29.78058 38198.79
mNN    78.00000 38209.78
mLM    19.00000 38292.51
mLASSO 22.00000 38309.11
mRT    22.00000 38711.66
LASSO (continue)
LASSO (continue)
      area1       area2       area3      yearc1      yearc2      yearc3
13.72498782 -1.85175963  0.09162263  4.97838839  3.71690657 -0.18975745
  location2   location3   cheating1
0.01331635 0.05631020 0.27463624 area1 area2 area3 yearc1 yearc3 location2 location3
2.2850872 -0.5173168 1.6240863 -7.7665983 3.2776033 0.0673355 0.3178812
kitchen1 cheating1
0.1209266 -0.1497227 Principal Component Regression
library(gamlss.foreach)
registerDoParallel(cores = 10)
source("~/Dropbox/github/gamlss-ggplots/R/data_stand.R")
source("~/Dropbox/GAMLSS-development/PCR/GAMLSS-pc.R")
X = formula2X(rent~area+yearc+location+bath+kitchen+
              cheating, data=da)
mPCR <- gamlss(rent~pc(x=X),~pc(x=X),
    data=da1, family=BCTo, bf.cyc=1, trace=TRUE)
Principal Component Regression
GAMLSS-RS iteration 1: Global Deviance = 38458.91
GAMLSS-RS iteration 2: Global Deviance = 38404.13
GAMLSS-RS iteration 3: Global Deviance = 38405.09
GAMLSS-RS iteration 4: Global Deviance = 38404.56
GAMLSS-RS iteration 5: Global Deviance = 38404.43
GAMLSS-RS iteration 6: Global Deviance = 38404.38
GAMLSS-RS iteration 7: Global Deviance = 38404.37
GAMLSS-RS iteration 8: Global Deviance = 38404.36
GAMLSS-RS iteration 9: Global Deviance = 38404.36
GAMLSS-RS iteration 10: Global Deviance = 38404.36 df AIC
mAM 29.78058 38198.79
mNN 78.00000 38209.78
mLM 19.00000 38292.51
mLASSO 22.00000 38309.11
mPCR 15.00000 38434.36
mRT 22.00000 38711.66summary
| ML Models | coef. s.e. | stand. of x’s | algo. stab., speed, conv. | non-linear terms | inter- actions | data type | auto sele-ction | interpre- tation |
|---|---|---|---|---|---|---|---|---|
| linear | yes | no | yes, fast, v.good | poly | declare | \(n>r\) | no | v. easy |
| additive | no | no | yes, slow, good | smooth | declare | \(n>r\) | no | easy |
| RT | no | no | no, slow, bad | trees | auto | \(n>r\)?? | yes | easy |
summary (continue)
| ML Models | coef. s.e. | stand. of x’s | algo. stab., speed, conv. | non-linear terms | inter- actions | data type | auto sele-ction | interpre- tation |
|---|---|---|---|---|---|---|---|---|
| NN | no | 0 to 1 | no, \(\,\,\) ok, \(\,\,\) ok | auto | auto | both? | yes | v. hard |
| PCR | yes | yes | yes, fast, good | poly | declare | both | auto | hard |
| LASSO | no | yes | yes, fast, good | poly | declare | both | auto | easy |
summary (continue)
| ML Models | coef. s.e. | stand. of x’s | algo. stab., speed, conv. | non-linear terms | inter- actions | data type | auto sele-ction | interpre- tation |
|---|---|---|---|---|---|---|---|---|
| Boost | no | no | yes, fast, good | smooth trees | declare | \(n<<r\) | yes | easy |
| MCMC | yes | no | good, ok, \(\,\,\) ok | smooth | declare | \(n>r\) | no | easy |
diagram
flowchart TB
  A[Data] --> B(n greater than r)
  A --> C( n less than r)
  B --> D[LM,GLM, \n GAM, NN ]
  C --> E[RidgeR, LASSO, Elastic Net, \n PCR, RF, \n Boosting, NN]
end

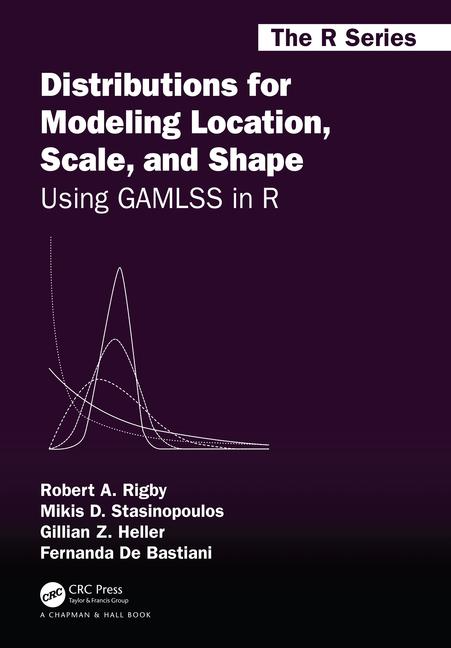
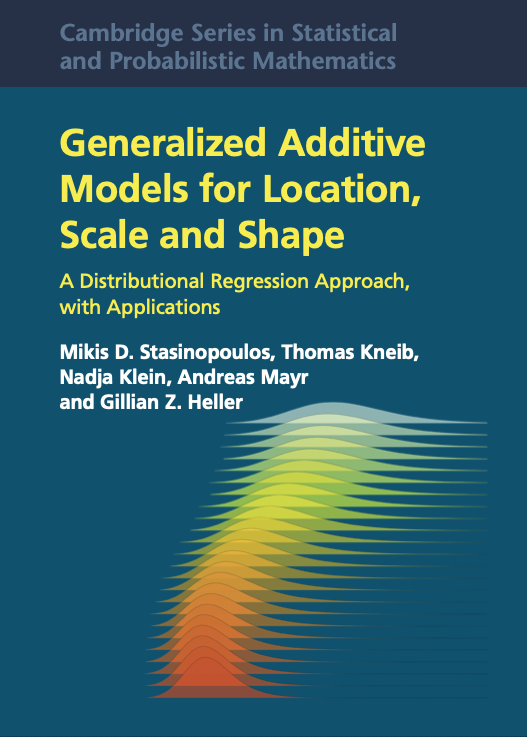 The Books

www.gamlss.com