what to compare
how ro compare
graphical diagnostic tools;statisticsstatistics| Data | Methods |
|---|---|
all data |
\(\chi^2\), GAIC |
test data |
LS, CRPS, MSE etc. |
data partitioning |
|
| K-fold | LS, CRPS |
| bootstrap | LS, CRPS |
no partition evaluation is done in the training dataset
likelihood ratio test for nested models \[LR= GD_1/ GD_0 \sim \chi^2(df0- df_1) \]partition: evaluation is done on new data
LS) \(\equiv\) Prediction Global Deviance (PGD)CRPS)MAPE)| models | df | AIC | \(\chi^2\) | BIC |
|---|---|---|---|---|
| mlinear | 24 | 22808.89 | 22855.45 | 22953.69 |
| madditive | 29.24 | 22814.33 | 22871.07 | 22990.77 |
| mfneural | 160 | 22930.36 | 23240.76 | 23895.69 |
| mregtree | 30 | 38754.64 | 38812.84 | 38935.64 |
| mcf | 404 | 38754.64 | 24481.28 | 26134.99 |
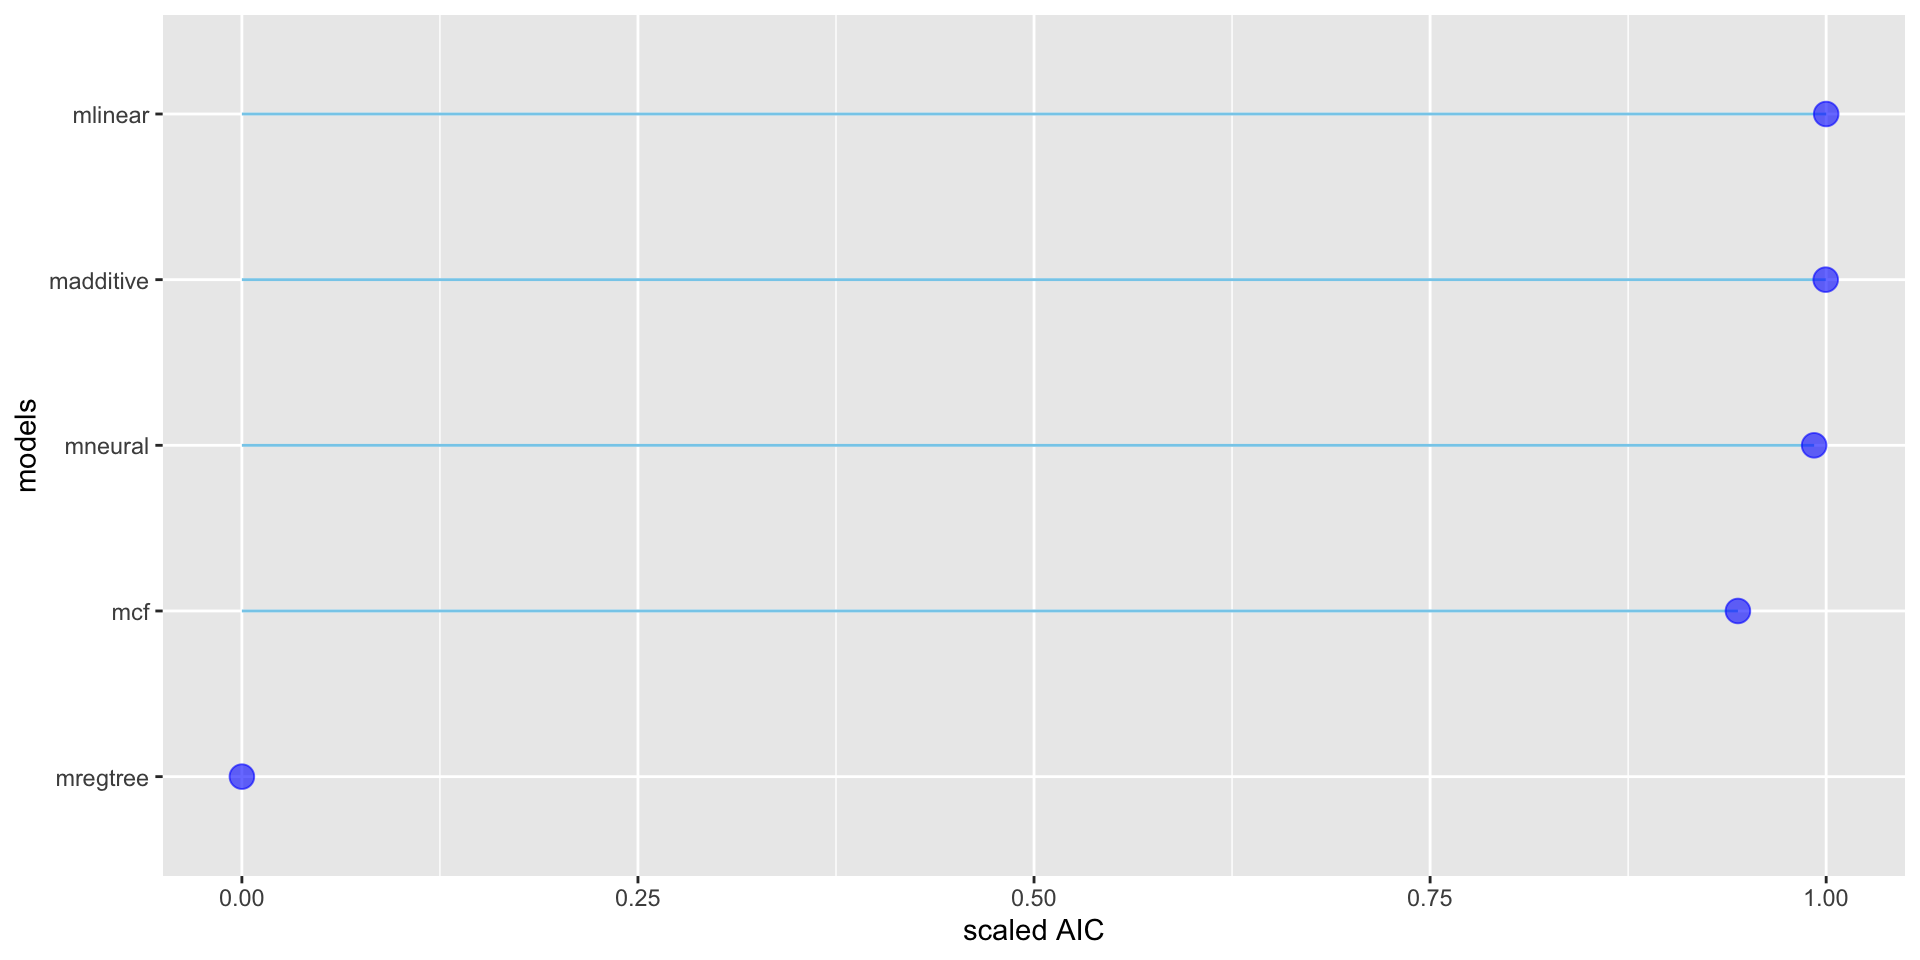
Figure 1: A lollipop plot of AIC of the fitted models.
| models | LS | CRPS | |
|---|---|---|---|
| mlinear | -6.2302 | 73.5738 | |
| madditive | -6.2288 | 73.8201 | |
| mfneural | -6.5126 | 79.9394 | |
| mregtree | -6.2930 | 78.6704 | |
| mcf | -6.2966 | 79.0644 |
the GAIC is well established and tested (the df of freedom need to be known)
the linear and additive model are good when there are not many explanatory variables (but somehow interactions have to be considered)
more work has to be done to standardised all ML techniques so their partitioning of data are comparable to the conventional additive models
The Books

www.gamlss.com